|
| | Lymphocytes | Granulocytes | Platelets |
|---|
| H1 |
 |
 |
 |
| H2 |
 |
 |
 |
| H3 |
 |
 |
 |
| H4 |
 |
 |
 |
| |
|---|
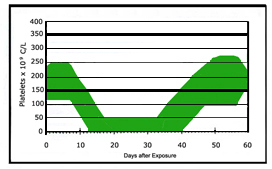
- These H1-4 graphs illustrate typical changes in blood component values over time following exposure to increasing doses of whole body radiation. These graphs reflect general ranges of effects, and patterns may differ for any given patient. Both trends and absolute numbers can help distinguish among the 4 clinical groups. The thicker horizontal lines represent the normal ranges. This kind of information is most useful when used in conjunction with clinical history, clinical observations, and other biodosimetry tools.
- Patterns of H1-4 injury suggest a likely duration of illness, and may be used to estimate recovery times and anticipate treatment requirements. The most important distinction is between the group of patients with H1, H2 and H3 vs. H4. Those with the H4 pattern are likely have sustained a large enough radiation insult to their marrow so that an insufficient residual population of hematopoietic stem cells remains to repopulate the bone marrow either "ever" or within a short enough time period to withstand the likely radiation-induced complications from hypoplasia/aplasia of the blood elements. Supportive care alone will not salvage this injury, and these victims are potential candidates for hematopoietic stem cell transplantation.
- Note that no H-category is associated with a specific whole body dose or dose range. The effect(s) of any estimated dose on circulating blood components and/or hematopoietic stem cells (HSCs) will vary widely among victims. In general, however, the greater the whole body dose, the more severe the outcome.
- Reversible hematopoietic injury (H1-3 patterns): a sufficiently large residual viable population of hematopoietic stem cells (HSCs) remains to repopulate the bone marrow. As a consequence, victims will require observation and/or supportive care but are likely not candidates for HSC transplant.
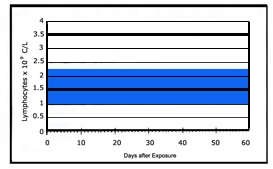
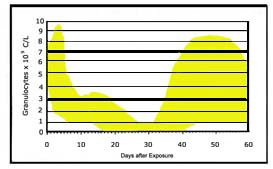
- Indicators of H1 injury:
- Lymphocytes remain in the normal range (1.5-3.5) x 109 cells/liter; single lymphocyte counts as low as 1.0 x 10⁹ may be seen.
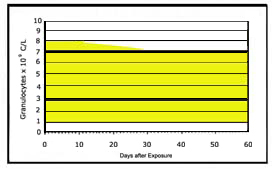
- Granulocytes remain in normal range (4-9) x 109 cells/liter; a single granulocyte count below normal range may occur but never below 1.0 x 10⁹ cells/liter.
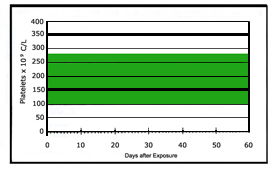
- Platelets usually remain in the normal range (150-350) x 109 cells/liter; a single platelet count around 100 x 109 cells/liter may be seen, with a potential drop between days 25 and 35 to the lower border of normal.
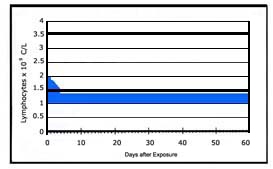
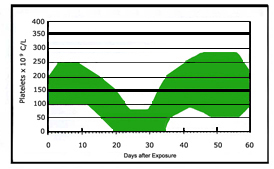
- Indicators of H2 injury:
- Lymphocytes decline from the normal range of (1.5-3.5) x 109 cells/liter within 2 days and remain between (0.5-1.5) x 109 cells/liter.
- Granulocyte levels increase in the first few days, followed by a drop. Then there is an abortive rise up to the lower limit of normal. Then cell counts decline slowly to nadir below 1.0 x 10⁹ cells/liter from day 20-30, followed by a variable rate of rise after days 30-35.
- Platelets remain on low side of normal (100-150) x 109 cells/liter until days 10-12, then nadir to about 50.0 x 10⁹ cells/liter about day 22 for 5-10 days, with regeneration between days 30 and 32.
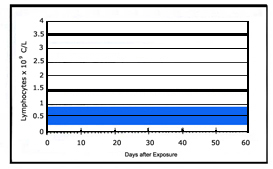
- Indicators of H3 injury:
- Lymphocytes drop within the first 48 hours and remain between (0.25-1.0) x 109 cells/liter.
- Granulocytes may increase within 1-3 days then decrease until day 5. An abortive rise may start at around day 5, keeping levels about 1.0 x 10⁹ cells/liter for about 5-8 days. Then counts drops to below 0.5 x 10⁹ cells/liter around days 10-15 and remain at this nadir for about 20 days, with gradual or rapid increase beginning around days 30-35.
- Platelet counts remain at or above the lower border of the normal range between (100-150) x 109 cells/liters until days 5-10. There is a further drop to a nadir of about (0-50) x 109 cells/liter at about day 16-18. The nadir lasts for 12-15 days, with recovery at variable rate beginning after days 35-40.
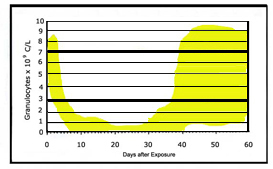
- Irreversible hematopoietic injury (H4 pattern): an insufficient residual population of HSCs remains to repopulate the bone marrow either "ever" or within a short enough time period to withstand the likely radiation-induced complications from hypoplasia/aplasia of the blood elements. Supportive care alone will not salvage this injury, and these victims are potential candidates for HSC transplantation.
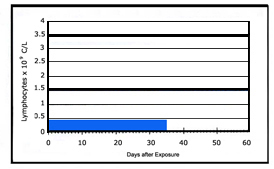
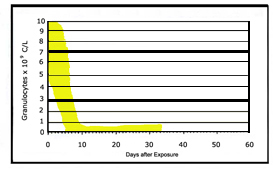
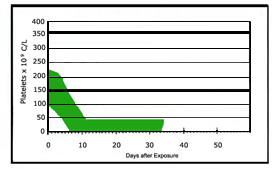
- Indicators of H4 injury:
- Lymphocytes decline within first 24 hours and remain between (0.1-0.25) x 109 cells/liter for weeks.
- Granulocytes may increase within 48 hours, then counts decline rapidly reaching values of ≤0.5 x 10⁹ cells/liter, with this nadir persisting.
- Platelets decline over the first 10 days and remain low.
- Although victims with H4 injury should be evaluated for potential HSC transplant, transplant efficacy after severe radiation accidents, such as Chernobyl, has not yet been proven to improve survival. As techniques for this complex therapeutic intervention continue to improve, some victims may derive potential benefit from this therapy. It is strongly suggested that patients be treated on approved clinical Hematopoietic Stem Cell transplant protocols, such as those from the Radiation Injury Treatment Network.
- With recent improvements in aggressive supportive care for victims of hematopoietic as well as other radiation-induced injuries, salvage may be possible following exposure to radiation doses previously considered lethal.
- H0 Pattern: not shown on graph above
- Represents a post-exposure hematological response that is within the normal range for non-exposed individuals.
Adapted from:
Fliedner TM, Friesecke I, Beyrer K. Medical Management of Radiation Accidents: Manual on the Acute Radiation Syndrome. (METREPOL) (PDF - 970 KB) (originally published by Oxford: British Institute of Radiology; 2001) Compendium to the main METREPOL document (PDF - 580 KB)
Comment and 2017-2018 Updates
- A retrospective study of 153 accidental radiation exposure cases (mostly from Chernobyl and Goiania) compared whole body dose estimates from the dicentric chromosome assay (DCA) to H1-H4 status assigned from CBCs as shown in the graphs and text above. Researchers showed that
- Single whole-body radiation doses (from DCA) of < 1 Gy and > 5 Gy corresponded in general with H0 and H3-4 respectively, consistent with medical expectations. This indicates that the extreme values for the 2 testing methods (CBC and DCA) correlated reasonably well.
- However, whole body doses (suggested by DCA) for between 1-5 Gy corresponded poorly to hematopoietic-ARS categories H1-3. Although the study had limitations, the data suggest that DCA results suggesting doses between 1 and 5 Gy are of limited value for medical decision-making regarding key triage issues such as (a) hospitalization for H2-3, but not H1 and (b) treatment decisions that differentiate between H1-3.
- Also, there were some H0 cases who were predicted to have high dose by the DCA, and some H2-4 cases predicted by DCA to have low dose.
- These data create concerns about using individual recommendations based solely on DCA (and perhaps other methods’) estimates of whole-body dose. Using clinical data from CBC results appear to provide more useful context for clinical decision making.
- Source of this update: Port M, Pieper B, Dorr HD, Hubsch A, Majewski M, Abend M, Correlation of Radiation Dose Estimates by DIC with METRPOL Hematological Classes of Disease Severity. Radiat Res. 2018 May;189(5):449-455. [PubMed Citation]
- The same group has published additional data about the validity and utility of using CBCs for decision-making. Their model also suggests how to consider triage and transport actions based on their H-ARS algorithm result.
|