
About Lymphocyte Depletion Kinetics
Warning: cautions and limitations
- The lymphocyte depletion kinetics algorithm used in this tool was developed by AFRRI BAT program.
- Lymphocyte depletion kinetics:
- A method of estimating dose following whole- or partial- body external radiation exposure which was absorbed over minutes to hours
- Serial CBCs are obtained and the absolute lymphocyte count is calculated and tracked over time.
- Absolute lymphocyte count: the sum of all types of circulating lymphocytes.
- Dose absorbed correlates with the rate of decline and nadir of peripheral blood absolute lymphocyte depletion.
- The "normal" range for absolute lymphocyte count can vary, even in a healthy adult population.
- See graph of the "normal" range for absolute lymphocyte count1
- Samples were collected from small number of "healthy" workers at AFRRI.
- These data suggest a "normal" range from about 1.35 - 3.5 x 10⁹ cells/liter
- Each medical facility will report its own "normal" blood count ranges, using its own equipment.
- "Normal" range may be influenced significantly by many factors, including the equipment used, and the ethnicity, age, health, and sex of the sampled reference population.
- Lymphocyte counts can be depressed (or in some cases, increased) by drugs, infection, and many clinical disorders unrelated to radiation.
- Even in healthy adults, absolute lymphocyte counts exhibit diurnal variation.
- If values for the absolute lymphocyte count remain in the "normal range" in samples taken over time, a significant radiation dose is unlikely.
- Nonetheless, the kinetics of the lymphocyte response to radiation is likely to be at least as important as the absolute lymphocyte count.
- See graph of the "normal" range for absolute lymphocyte count1
- Lymphocyte depletion kinetics algorithms used in this tool are based on samples collected from adults, primarily those involved in radiation accidents.1-5
- Results of this assay have not been validated in children.
- This tool can estimate radiation dose based on 1, 2, or 3 absolute lymphocyte count measurements over 11 days after the exposure.
- This tool requires the following to yield a valid result
- Values must be entered in units of: [measured value] x 109 cells/liter
- See chart for conversion among alternative units. [Adapted from the AFRRI BAT program]
- Values must be in the following ranges
- Entering > 7.0 x 10⁹ cells/liter will yield warning message: "Lymphocyte count is out of range"
- Entering < 0.007 x 10⁹ cells /liter will yield warning message: "Lymphocyte count is out of range"
- For calculations using a single absolute lymphocyte count, values must be
- > 0.007 x 10⁹ cells/liter AND
- ≤ 1.35 x 10⁹ cells/liter
- For calculations using multiple absolute lymphocyte counts
- At least one total lymphocyte count must be ≤ 1.35 x 10⁹ cells/liter OR
- One blood draw must occur ≥ 36 hours after exposure
- Values must be entered in units of: [measured value] x 109 cells/liter
- Time range for drawing blood for the lymphocyte depletion kinetics tool
- Latest allowable time: 264 hours (11 days) after the "date/time of exposure"
- The tool will not allow entry of any measurements taken before time of exposure.
- How often should blood counts be repeated when response resources are not constrained?
- The AFRRI BAT program suggests obtaining a blood cell count as soon as feasible after radiation exposure and makes the following recommendations
- If the absorbed dose is known or suspected to be ≥5 Gy
- Obtain blood cell counts about every 9-12 hours for 2 to 3 days after irradiation and then every 24 hours for 3 to 9 days.
- > 5 Gy gamma-ray equivalent dose estimate can be based on prodromal symptoms like initial vomiting < 2 hours after exposure or other dosimetric end points like physical dosimetry.
- If the absorbed dose is known or suspected to be < 5 Gy
- Obtain blood cell counts about every 24 hours for 9 days.
- < 5 Gy gamma-ray equivalent estimate can be based on biological end points like initial vomiting > 2 hours after exposure and other dosimetric endpoints like physical dosimetry.
- If the absorbed dose is known or suspected to be ≥5 Gy
- The AFRRI BAT program suggests obtaining a blood cell count as soon as feasible after radiation exposure and makes the following recommendations
- How often should blood counts be repeated when response resources are constrained?
- In a large event, obtain blood count as soon as feasible and repeat as clinically indicated and resources permit.
- Although accuracy of dose estimation increases if multiple absolute lymphocyte count values are tracked and plotted over time, drawing sequential blood counts at times optimal for biodosimetry may not be feasible in a large mass casualty event.
Background information
- Lymphocyte depletion kinetics
- A method of radiation dose estimation following whole- or partial- body acute radiation exposure over minutes to hours
- Serial CBCs are obtained and the absolute lymphocyte count is calculated and tracked over time
- Absolute lymphocyte counts are the sum of all types of circulating lymphocytes
- The magnitude, rate, and nadir of peripheral blood absolute lymphocyte depletion are correlated with dose
- Lymphocyte depletion rate is directly related to radiation absorbed dose.4
- 2-4 Gy: lymphocyte decline occurs over ~4-6 days
- 4-6 Gy: lymphocyte decline requires ~2-4 days
- At sufficiently high radiation doses, lymphocyte decline may be measurable from day 1 post-exposure.
- Lymphocyte depletion kinetics can be used
- To provide an early/preliminary estimate of radiation dose
- To guide initial clinical management and triage of the patient, but...
- Radiation dose estimates based on lymphocyte depletion kinetics should be used in conjunction with all other clinical and laboratory information
(See Radiation Exposure Algorithm)
- Radiation dose estimates based on lymphocyte depletion kinetics should be used in conjunction with all other clinical and laboratory information
- In large scale radiation emergencies, biodosimetry based on lymphocyte depletion kinetics, clinical signs and symptoms, and dose reconstruction from geographic information are likely to be available more rapidly than biodosimetry based on dicentric chromosome assay.
- About this lymphocyte depletion kinetics tool
- All results are calculated in gamma dose (Gy) whole-body equivalents.
- It uses models developed by two sources, Guskova and Goans.
- The Guskova model 4, 5
- These data, while described in gamma dose (Gy) equivalents, may include some criticality accident cases in which a variable percentage of the dose involved neutrons. (Guskova A and Baranov AE, personal communication to AFRRI).
- Progressively declines from day 1 through day 9, after 1 to 10 Gy of gamma radiation.4
- The Goans model 2, 3
- Goans et al. developed a simple model for early dose assessment based on serial blood lymphocyte counts after an acute whole-body exposure to gamma radiation.
- The Guskova model 4, 5
- Limitations of this tool
- It is not generally suitable for assessing partial-body exposures or internally deposited radioisotopes.6
- However, newer techniques for estimating partial body dose have been developed. (See reference list, partial body radiation section.)
- Results may be affected by dose rate from exposure and radiation quality (e.g. mixed beam exposure with significant neutron component).
- Besides the Guskova, Goans, and BAT models for estimating dose from ALC, there are other models, including those noted below and from IAEA. (See table)
- It is not generally suitable for assessing partial-body exposures or internally deposited radioisotopes.6
Illustrations
Dose estimates based on individual lymphocyte counts (Guskova's method)
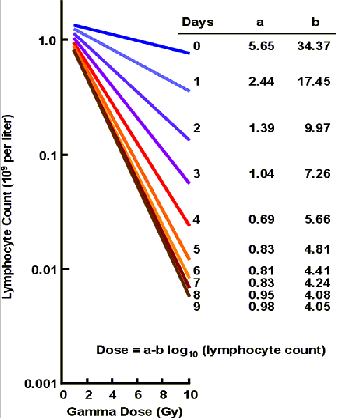
Notes on the graph above:
- The rate of decline and the degree of lymphocyte depletion are directly related to whole-body gamma dose (Guskova et al. 1988).
- These data, while described in gamma dose (Gy) equivalents, may include some criticality accident cases in which a variable percentage of the dose was from neutrons, not just gamma. (Guskova A and Baranov AE, personal communication to AFRRI).
- Numbers at the far right end of each line refer to the number of days post-exposure.
- The y-axis uses a log scale.
- The formula for the relationship is
- Dose (in Gy) = a - b (log y)
- a and b are coefficients
- y is total lymphocyte count expressed in units of 109 cells/liter
- AFRRI BAT software application
- Guskova AK, Baranov AE, Gusev IA: Acute Radiation Sickness: Underlying Principles and Assessment. In: Gusev IA, Guskova AK, Mettler FA Jr, eds.: Medical Management of Radiation Accidents, 2nd ed. Boca Raton, Fl: CRC Press, 2001, p 45.
- Guskova AK, et al. (1988) Acute radiation effects in victims of the Chernobyl nuclear power plant accident. In: Sources, Effects and Risks of Ionizing Radiation, United Nations Scientific Committee on the Effects of Atomic Radiation (UNSCEAR). New York: UNSCEAR, appendix.
Lymphocyte kinetics dose estimate (Goans' method)
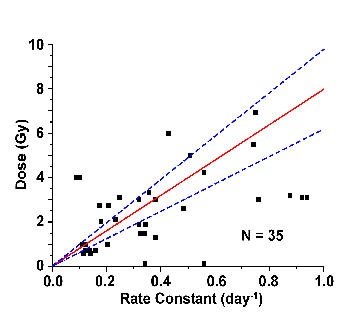
Notes on the graph above:
- Illustrates the relationship between estimated photon dose and lymphocyte depletion rate (rate constant) with a 95% confidence interval (dotted blue line) around the best fit (red line).
- Each data point (square) represents a single case.
- Total number of cases (N) used in the illustration is 35.
- The lower limit for detection of exposure by lymphocyte depletion kinetics is about 1 Gy.
- AFRRI BAT software application
- Goans RE, Holloway EC, Berger ME, Ricks RC. Early dose assessment following severe radiation accidents. Health Phys. 1997 Apr;72(4):513-8. [PubMed Citation]
- Goans RE, Holloway EC, Berger ME, Ricks RC. Early dose assessment in criticality accidents. Health Phys. 2001 Oct;81(4):446-9. [PubMed Citation]
Contour of lymphocyte depletion kinetics following photon radiation exposure in humans
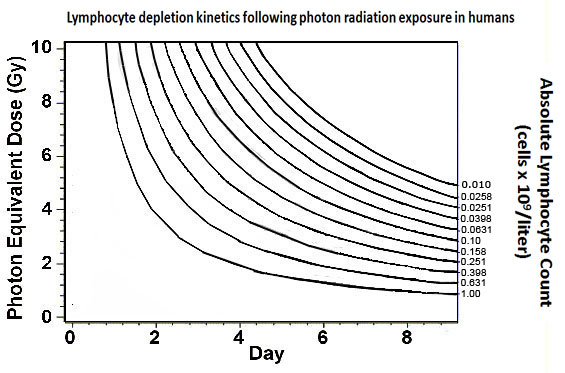
Notes on the graph above:
- Each curve connects points with the same absolute lymphocyte count.
- This graphic illustrates that
- The same absolute lymphocyte count value measured on different days reflects a different photon equivalent dose.
- The same photon equivalent dose would be suggested by different absolute lymphocyte count values on different days.
- Examples
- An absolute lymphocyte count of 1.0 x 10⁹ cells/liter on day 8 is associated with an estimated photon equivalent dose of 0.8 Gy.
- The same absolute lymphocyte count on day 1 is associated with an estimated photon equivalent dose of 10 Gy
- This graphic should not be used clinically; it is for concept illustration only.
- This graphic is adapted from the AFRRI BAT program.
- AFRRI BAT software application
- Goans RE, Holloway EC, Berger ME, Ricks RC. Early dose assessment following severe radiation accidents. Health Phys. 1997 Apr;72(4):513-8. [PubMed Citation]
- Goans RE, Holloway EC, Berger ME, Ricks RC. Early dose assessment in criticality accidents. Health Phys. 2001 Oct;81(4):446-9. [PubMed Citation]
See other graphs on REMM of blood count data illustrating radiation effect
- Lymphocyte Depletion Kinetics Graph used to estimate whole body dose
- Radiation Effects on Blood Counts (1)
- Radiation Effects on Blood Counts (2)
- Radiation Effects on Blood Counts (3)
References
- AFRRI BAT software application; AFRRI BAT program reference list
- Goans RE, Holloway EC, Berger ME, Ricks RC. Early dose assessment following severe radiation accidents. Health Phys. 1997 Apr;72(4):513-8. [PubMed Citation]
- Goans RE, Holloway EC, Berger ME, Ricks RC. Early dose assessment following severe radiation accidents. Health Phys. 1997 Apr;72(4):513-8. [PubMed Citation]
- Guskova AK, et al. (1988) Acute radiation effects in victims of the Chernobyl nuclear power plant accident. In: Sources, Effects and Risks of Ionizing Radiation, United Nations Scientific Committee on the Effects of Atomic Radiation (UNSCEAR). New York: UNSCEAR, appendix.
- Guskova AK, Baranov AE, Gusev IA: Acute Radiation Sickness: Underlying Principles and Assessment. In: Gusev IA, Guskova AK, Mettler FA Jr, eds.: Medical Management of Radiation Accidents, 2nd ed. Boca Raton, Fl: CRC Press, 2001, p 45.
- Moulder JE. Post-irradiation approaches to treatment of radiation injuries in the context of radiological terrorism and radiation accidents: a review. Int J Radiat Biol. 2004 Jan;80(1):3-10. [PubMed Citation]
See also:
- Dose Estimator for Exposure
- Biodosimetry References List
- Four References Comparing Biodosimetry Tools
- Biodosimetry Reference List: graphic listing